
Post-processing cannot increase information
This is axiomatic in science generally, but especially in microscopy.
At it’s core a microscope is a low pass filter, and what it’s filtering is spatial information. A sample’s structure (that’s what you’re trying to measure with a microscope) is made up of various spatial frequencies and the microscope, due to the wave nature of light, can only capture the lower frequency ones (remember, higher spatial frequencies are the Fourier representation of higher resolution information). The upper limit of spatial frequencies that a microscope can transmit is known as the diffraction limit. Super-resolution microscopes bypass this limit by cleverly encoding higher spatial frequencies such that they fall into the pass-band of the microscope. Regardless, every microscope, even a “super” one, has a maximum spatial frequency which it can transmit.1
What’s all this got to do with deconvolution? Well I’ve seen a few people, papers, and even microscope companies making claims that deconvolution will improve the resolution of your data.2 Unfortunately, this is 🐴💩. A microscope’s resolution is fundamentally limited by the laws of physics. You cannot recover information that was never present in the first place.3 To make matters worse most of these offenders will use the point spread function (PSF), the ultimate arbiter of microscope performance, to demonstrate this improvement. What I mean is, they’ll show a side-by-side comparison of the raw PSF and the deconvolved PSF. What do you think will happen if you run an iterative deconvolution algorithm with the kernel and image being the same? If they’re identical you’ll get a single bright pixel! Even if they’re just similar you’ll get a fantastical result and if you’re not careful, you might look at that result and think,
Gee, this deconvolution thing sure is swell! It turned this blurry, ugly PSF into a sharp, beautiful one! I can’t wait to buy this expensive microscope and/or software and try it out on my data because I’ll see the same improvement in resolution!
Unfortunately for you, if you did think this, you’d be wrong; very, very wrong.
To make this concrete, let’s look at an example (Fig 1.). Here I’ve generated a simulated widefield epi-fluorescent PSF4 (top) and the corresponding optical transfer function (OTF, bottom) for a 1.46 NA oil objective (left column) at a pixel size of 40 nm and an emission wavelength of 525 nm (same as GFP). Next (middle column) I’ve simulated an image of a point source; essentially this is just the PSF with added shot noise and camera noise for an sCMOS camera. Note that for both the ground truth PSF (left column) and simulated image of a point emitter (middle column) the OTF is bounded by the traditional Abbe diffraction limit (white circle, bottom row). However, if I deconvolve5 the image (middle column) with the PSF (left column) you can see that the result exceeds the traditional diffraction limit (right column), substantially.
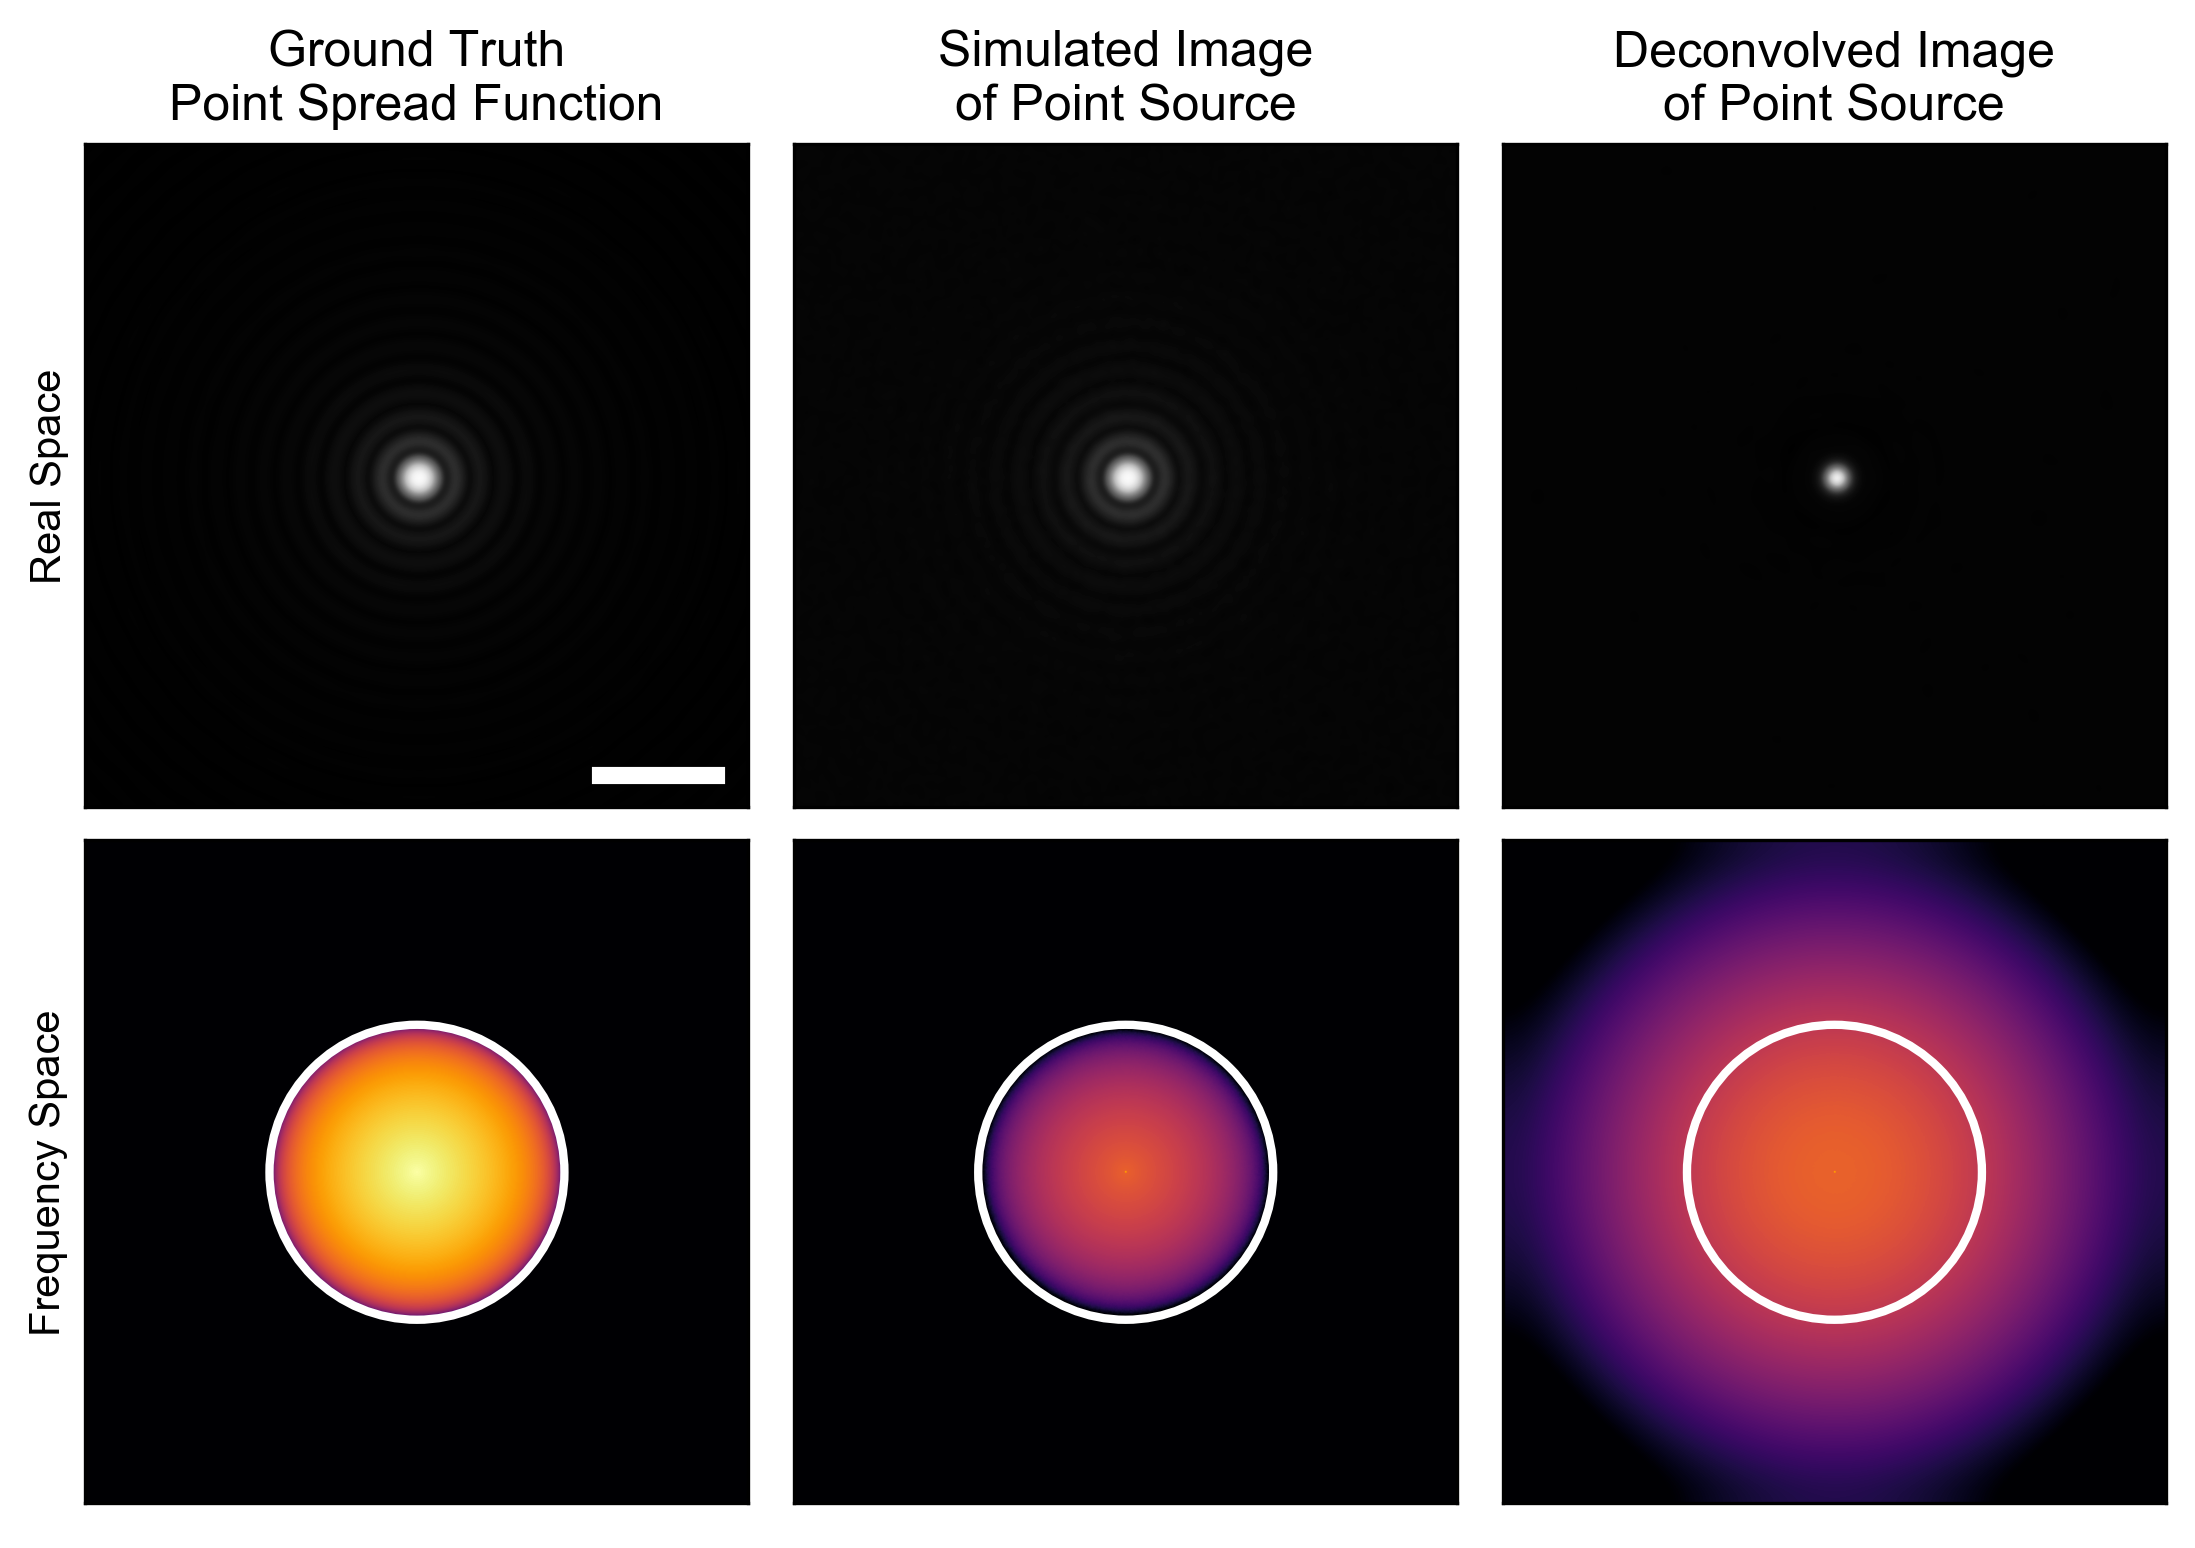
Simulating the effect of deconvolving an image of a point emitter. A gamma correction of 0.5 was applied to the top row and the bottom row is shown on a logarithmic scale. White lines indicate the Abbe diffraction limit. Scale bar is 1 µm.
“Ok,” you say, “but why do I, as a microscopy user, care about this subterfuge?” That’s a good question and it leads to my second example (Fig. 2). As my simulated sample (first column) I’ve used the ubiquitous USAF-1951 target. The full target is shown on the top row and a zoom of the central ROI (red square) is shown on the bottom row (scale bar is 1 µm). I’ve scaled the image such that the finest resolution pattern is 80 nm (160 nm per line pair). Next (second column) I simulate an image of this sample taken by a microscope with the PSF shown in the left column of Fig. 1. Note that the Abbe diffraction limited resolution of this microscope is 180 nm: over two fold worse than the finest pattern shown in the bottom row. Deconvolving the simulated image with the ground truth PSF (third column) results in a definite improvement of contrast6 but the line pairs that are unresolved in the original image remain unresolved in the deconvolved image, as expected. Finally, I demonstrate what a deconvolved image might look like if one were to believe the resolution “enhancement” shown in Fig. 1 (right column). Here, even the finest resolution pattern is clearly resolved. In essence, I’ve more than “doubled” the resolution of the microscope with a simple algorithm; and I didn’t need to pay the megabucks for a SIM, STED, or PALM scope!
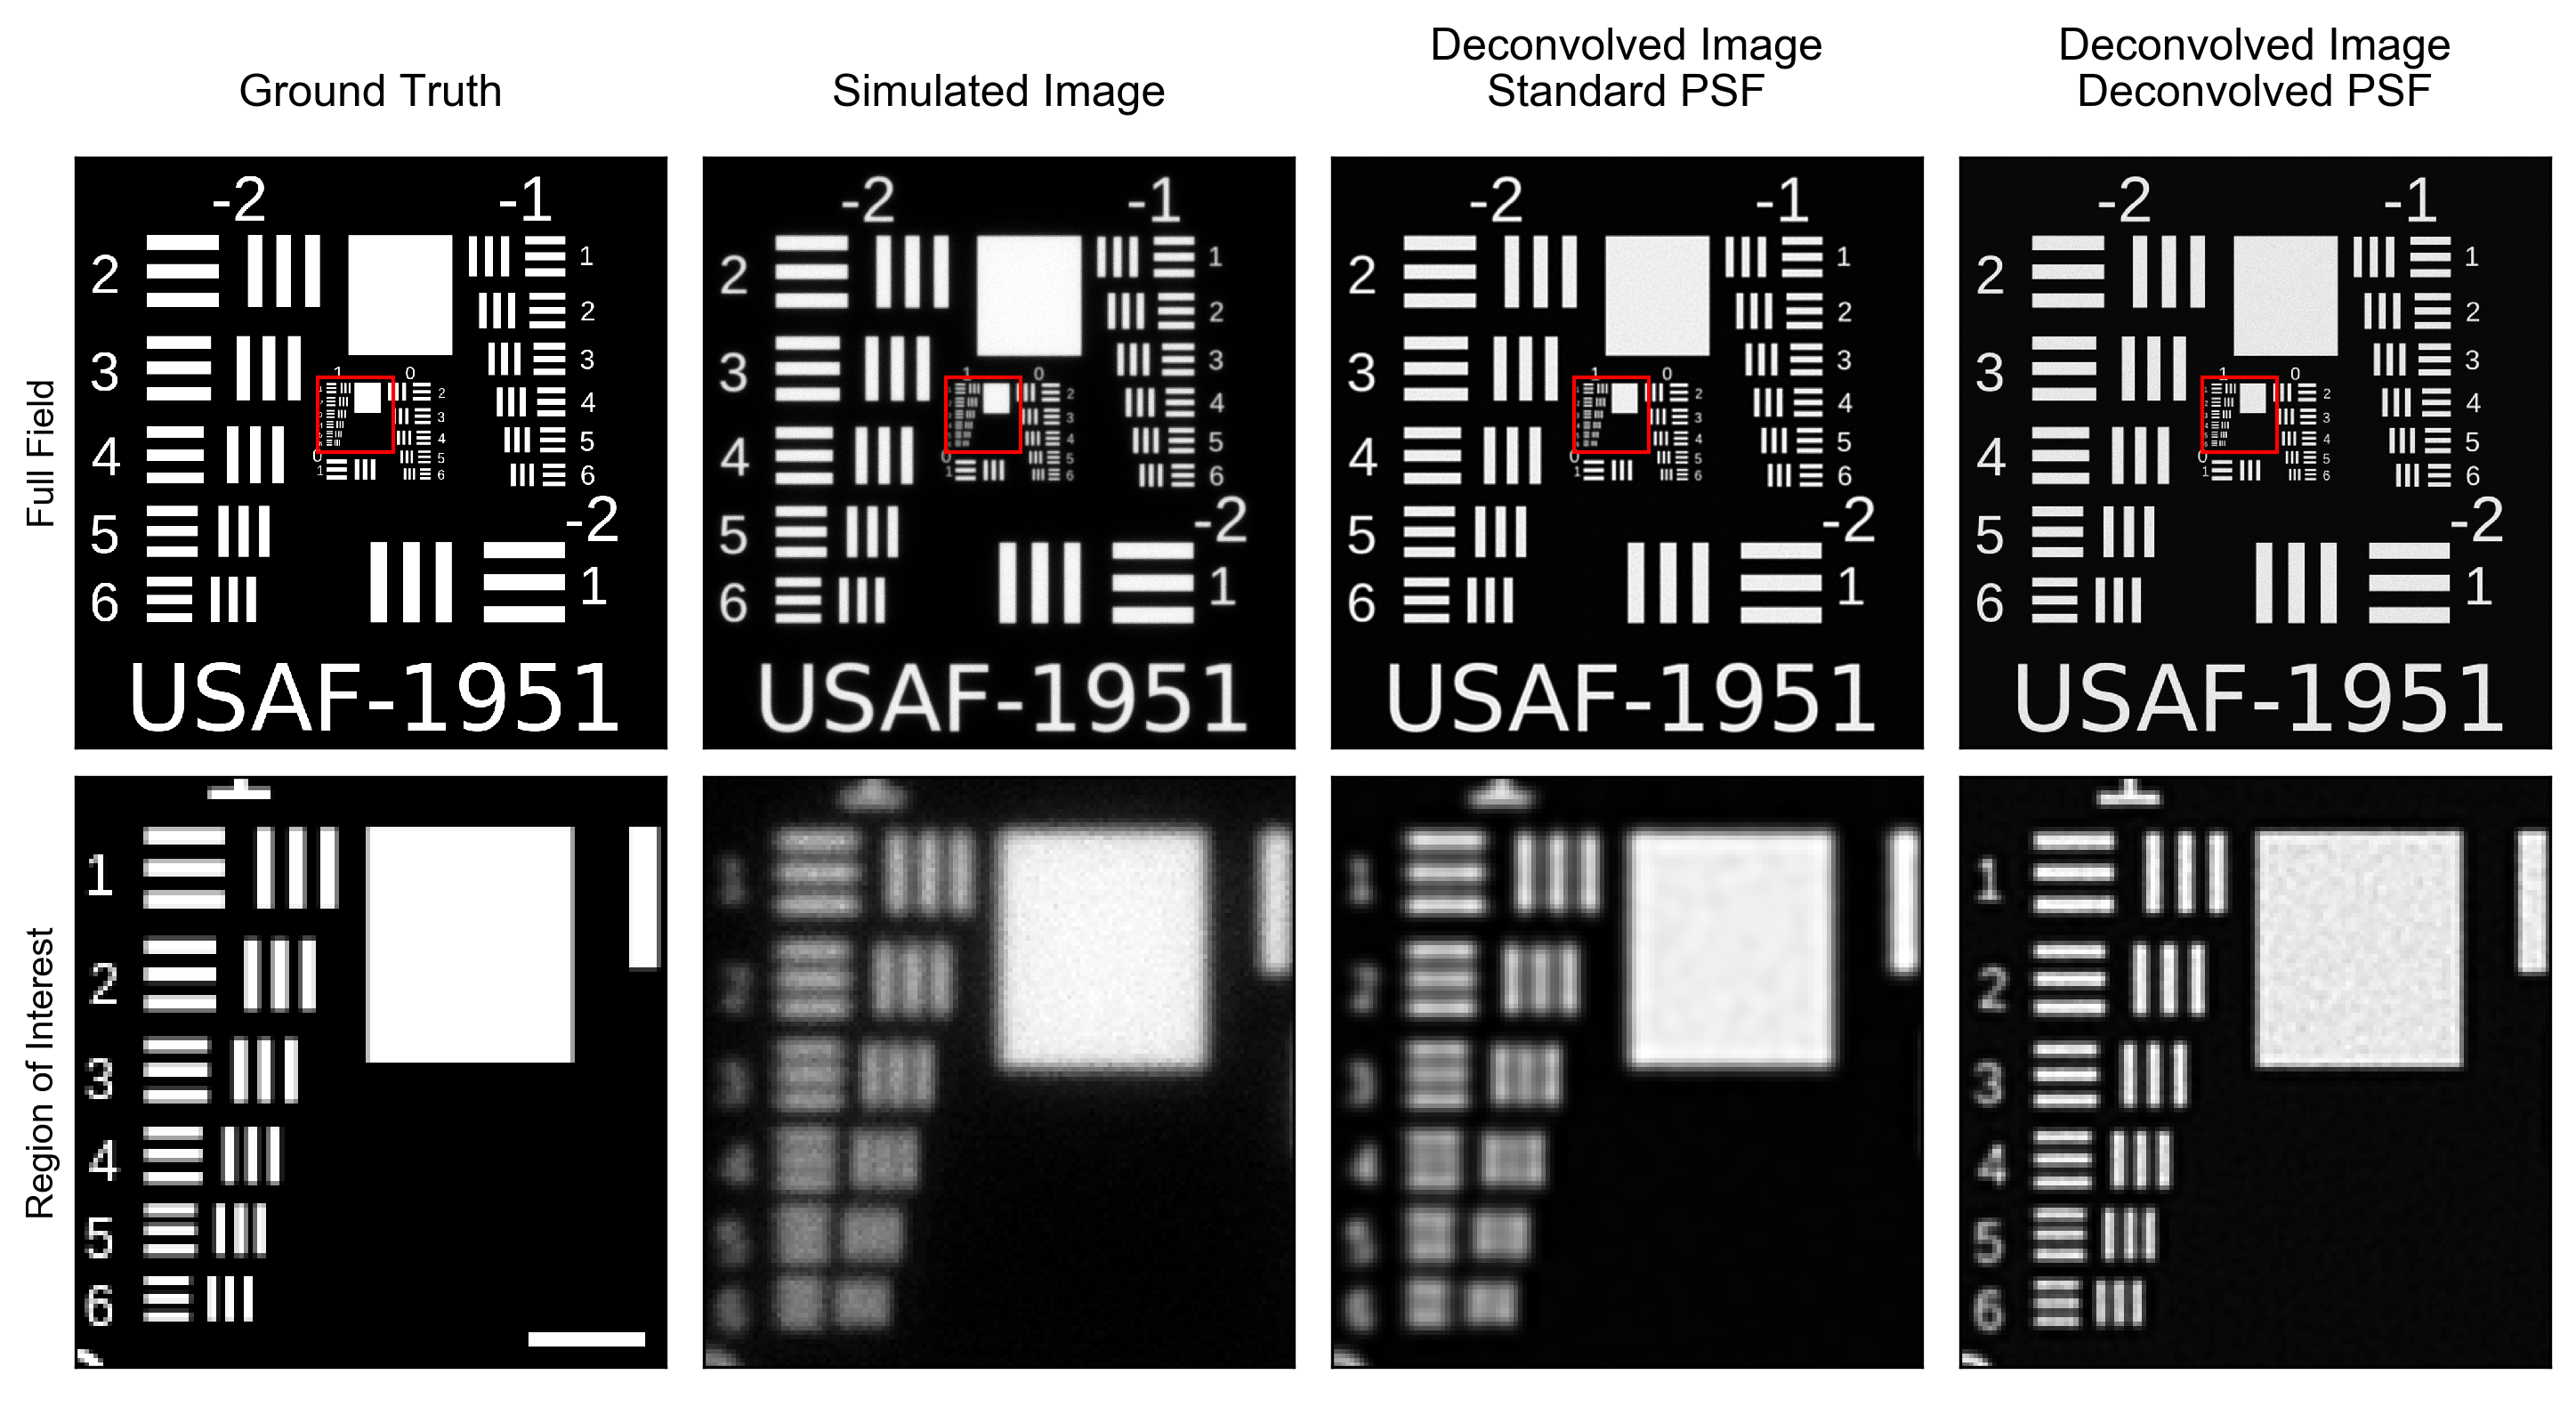
Can deconvolution resolve the “unresolvable”? No, it can’t.
Now you might say,
Oh come one, those are simulations and I won’t believe anything except for hard, experimental, evidence!”
Sounds like you’re my kind of scientist! Lucky for you I’ve gone ahead and collected the 3D-PSF of a 0.95 NA air objective using a sub-diffractive (100 nm) fluorescent bead (left column, Fig. 3). Then I’ve deconvolved7 this image using two different estimates of the PSF: for the first (middle column) I radially averaged the image itself; for the second (right column) I simulated the PSF based on the microscope parameters.4 In both cases, there is a significant, and yet completely imaginary, “improvement” in the apparent resolution.8 Equally troubling is the fact that the “missing cone” has been completely filled, which erroneously suggests that deconvolution can impart optical sectioning.
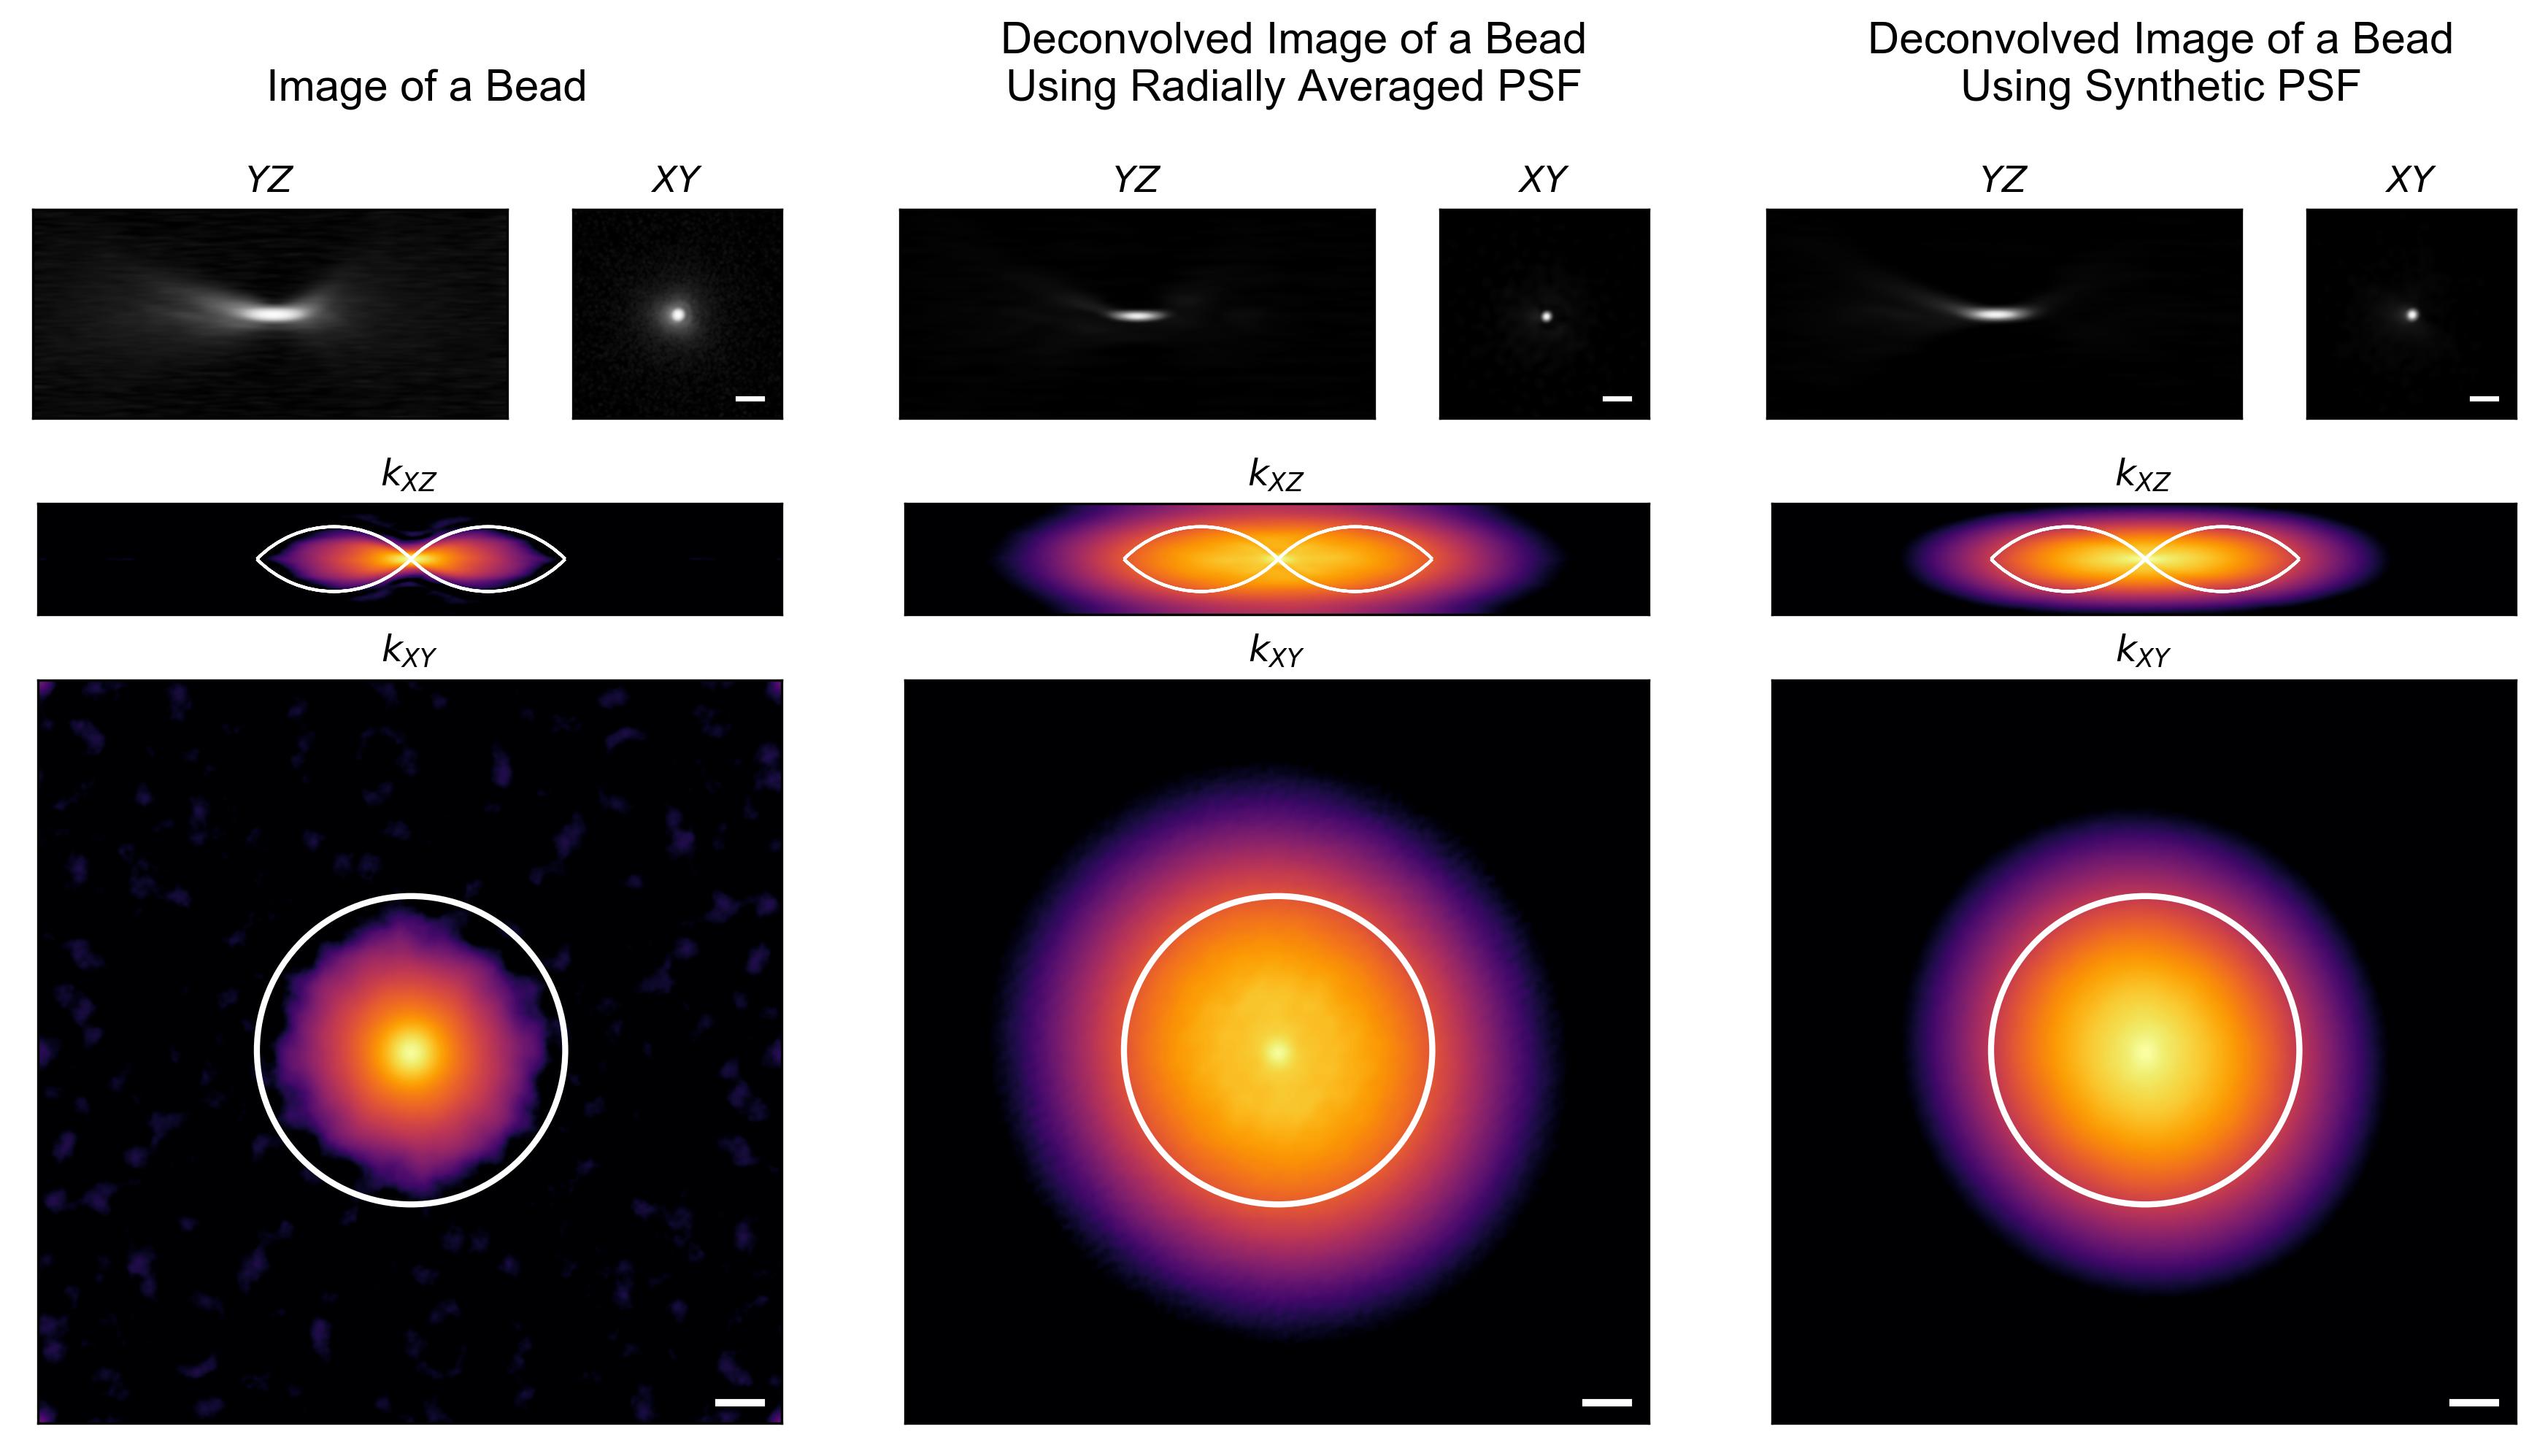
Does the same thing happen with real data? Sure does! Scale bars are 1 µm and 1 µm$^{-1}$, respectively.
Deconvolution is a powerful tool, but like all powerful tools it can be powerfully misused. The resolution of an imaging system is limited by physics and, unfortunately, cannot be improved with algorithms. Deconvolution is an extremely useful tool to improve your images (it denoises while increasing contrast! 🤩) and can be an effective preprocessing step before subsequent analyses, but please, please, please do not deconvolve your PSF, that just doesn’t make any sense.
-
At some point I’ll rant ad nauseam about resolution and it’s definition (or lack thereof) in optical microscopy. For now let’s just say that the maximum spatial frequency a system can pass isn’t quite as important as the maximum spatial frequency you can measure: a number that is completely SNR dependent. The OTF of the microscope really describes the best case scenario which is rarely, if ever, achieved in practice. ↩︎
-
I’m not going to name any names 🤐. ↩︎
-
Yeah, yeah, yeah, I can hear you complaining already, “But I just read these papers and they show that the deep learning networks can improve resolution!” That’s an argument for a different day, but I’ll leave you with this for now. ↩︎
-
Using my
pyotfpackage ↩︎ -
A standard Richardson-Lucy deconvolution algorithm was run for 10 iterations without acceleration. Running the simulation with a different implementation yielded similar results. ↩︎
-
If you define resolution as FWHM, which I think is wrong, then that improves as well. ↩︎
-
Using the same Richardson-Lucy algorithm as above except with 20 iterations and linear acceleration. ↩︎
-
More when using the radially averaged image, likely because it captures more of the aberrations of the microscope. ↩︎